Getting to know Widgets
Getting to know Visible Legacy Widgets
The Visible Legacy Map "Widget" shows you a great deal of information about the a selected topic in a compact window. The Widget is intended to be embedded in an external web page to offer the user visual context and encourage navigation. Please see "Embedable Map Widget for your web page" below for technical details.
Using the interactive nodes of the Widget you can view information about related projects and the context of people, organizations and documents, discerning relationships and discovering new insights. You can filter the nodes to focus on a type. You can open the Timeline and see the progress over time. When you discover a topic of interest, you can open a full page in Visible Legacy Navigator for more information and features by clicking on the lower-left icon "Open map in Visible Legacy".
This Help page describes some of the features of Widgets in more detail.
Collaboration Map
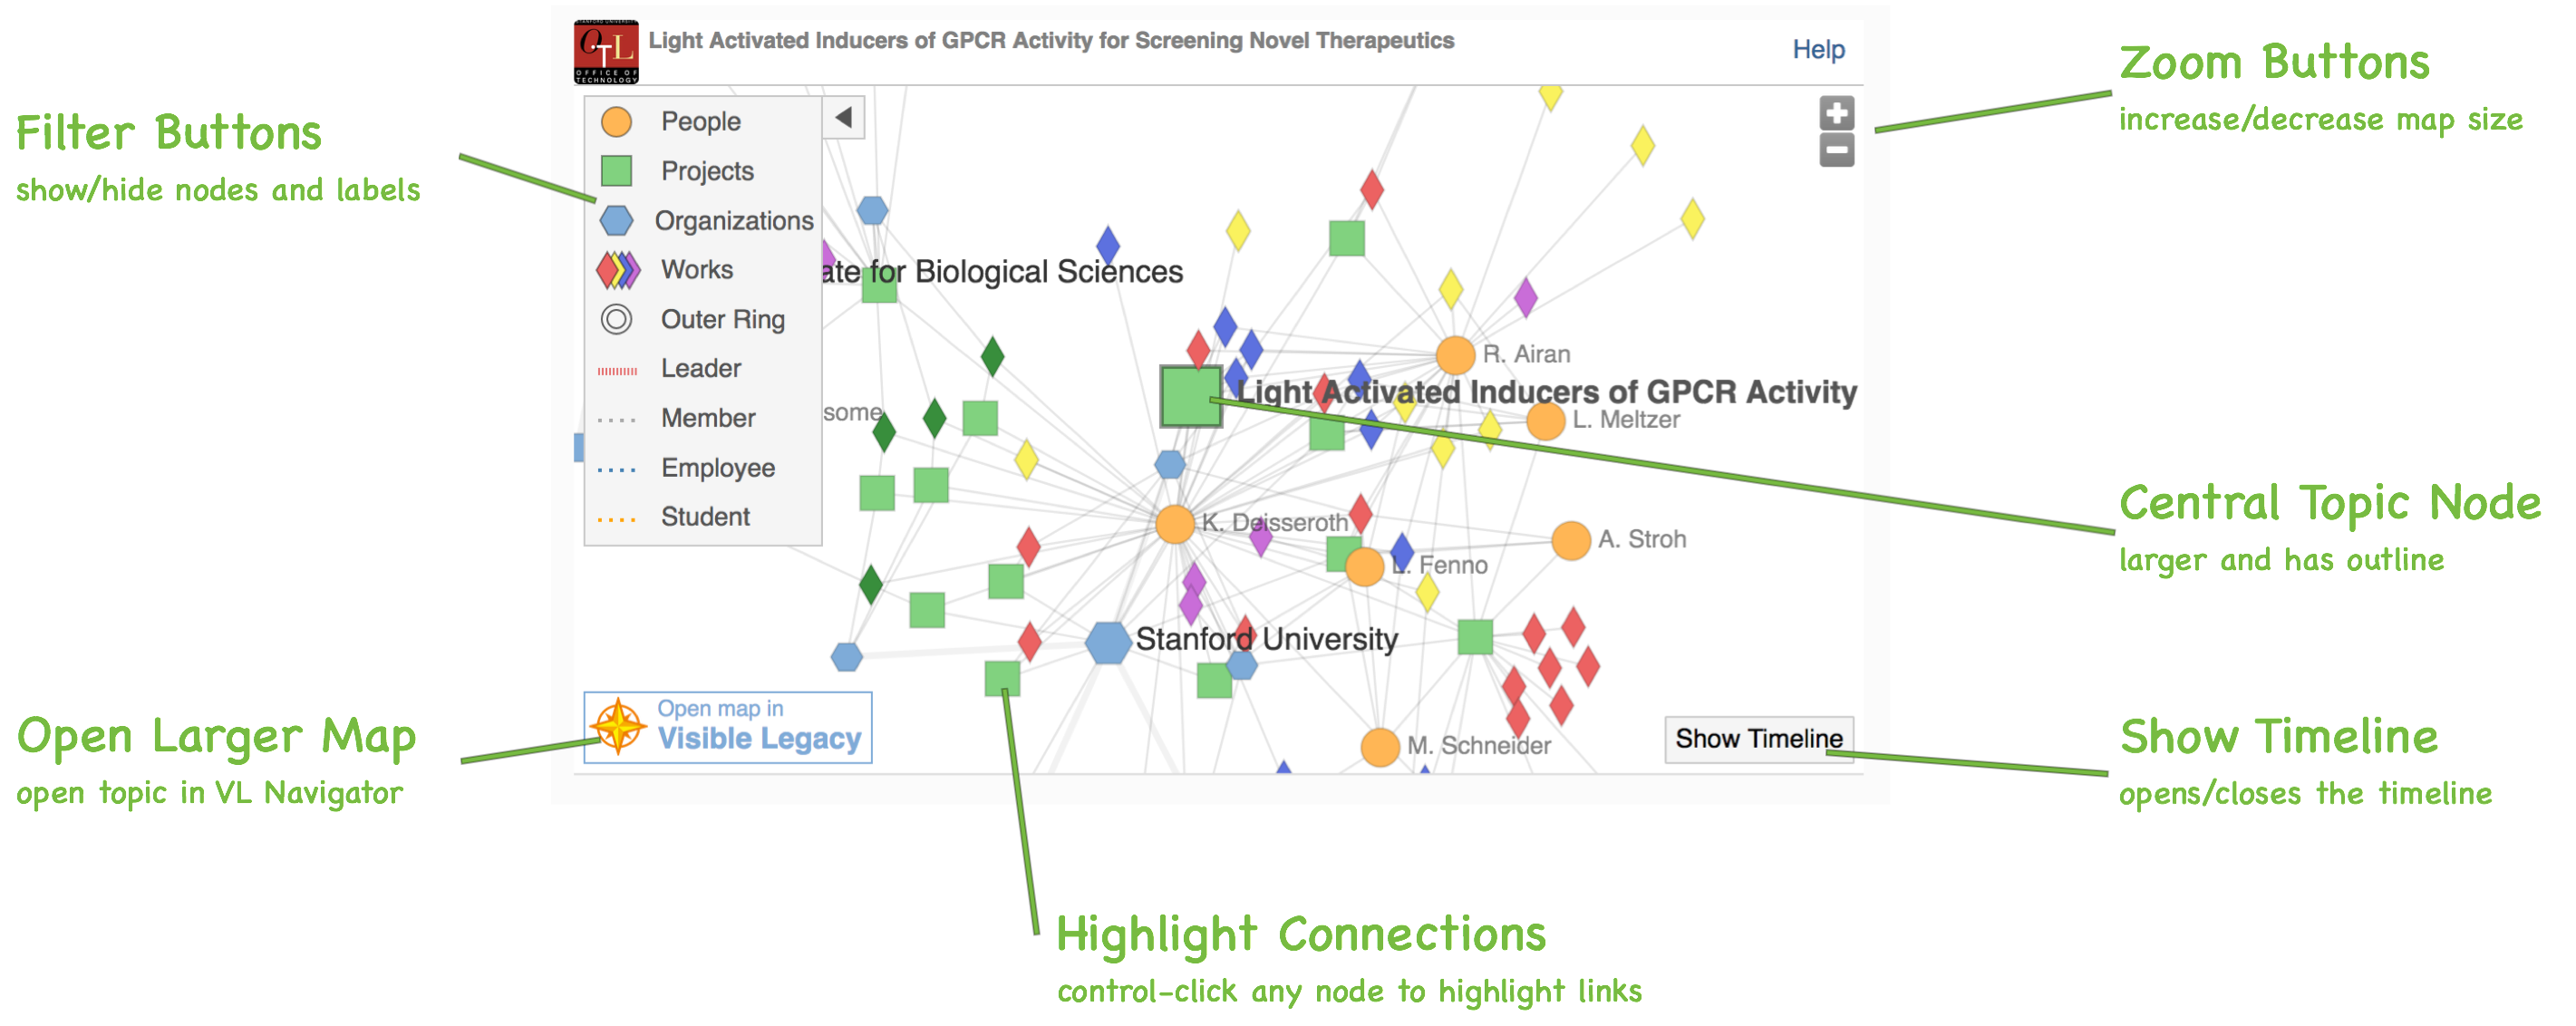
The Collaboration Map shows the Topic as the central node surrounded by projects, people and organizations who are project participants. Additional context is provided by the various documents such as papers, patents, inventions. Use the + / - controls to zoom in to see more detail or zoom out to see more relationships. You can drag nodes around to orient the connections, or drag the white background to slide the whole map.
The lines represent a connection. People and Organizations participate in Projects. People author Papers and Invention Disclosure documents and then participate in the Patent. News Stories are written about People and Organizations. People have a relationship with an Organization such as being a Lab Director or a Department Member. Sometimes more distant Organization-to-People relationships are shown with a dotted line. Click on a Node to open a Callout Box of information.
A Key to the Nodes
 Green Boxes are Projects
 Orange dots are People
 Blue Hexagons are Organizations
-
 Yellow are written works documents
 -
 Purple diamonds are news stories
 -
 Red diamonds are innovation disclosures
 -
 Blue diamonds are patent documents
 -
 Green diamonds are grant documents
The Node color and shape represent different topics as shown above. The documents, news, disclosures, grants and patents are all hidden by the "Works" filter.
Callout Box
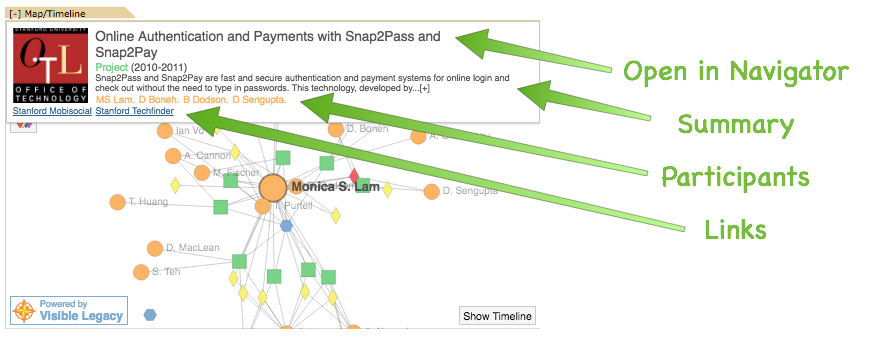
By clicking a node you will open an information box or "Callout Box" (example shown above) containing more information about the node topic. Each call-out has related links depending on the kind of node, for example researcher profiles and lab sites, project description sites, and related disclosure pages. You will also find a Topic Summary with a paragraph that can be expanded by using the small [+] at the end. You may find project participant names.
Clicking the Topic title will open the corresponding topic in the external site in a new window, if available. Clicking the links in the Callout will take you directly to the source information web site, for example the paper publisher or the patent office page.
Timeline
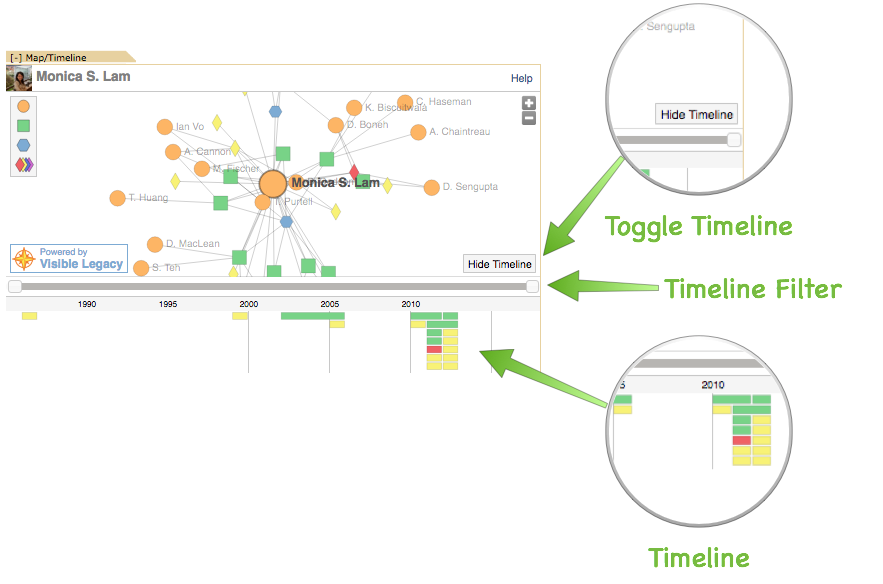
The data in the Collaboration Map is also presented on a timeline. Use the Show Timeline button and Hide Timeline button to open and close the timeline. The timeline shows projects and documents related to the central node topic. The Widget visual elements interact: rolling over a timeline element will highlight the node on the map and vice versa.
Timeline Filter
With the timeline open you can see this filter. The two-handled grey slider is a Timeline Filter which sets the start and end date of a date-range showing nodes within a time of interest. The Timeline Filter fades nodes outside the set time period in the map, timeline, and Tabs.
Filter Buttons
Use the Filter By Type buttons to improve clarity of topics of interest by fading and almost hiding selected nodes. Buttons may be used singly or together.
Go to Navigator
When you discover a topic of interest, you can open a full page in Visible Legacy Navigator for more information and features by clicking on the lower-left icon "Open map in Visible Legacy". This will open a new Tab or Windows with the Topic displayed in our full-featured Visible Legacy Navigator website. The Navigator presents more nodes and details in the map and offers additional features and views. Visit the Navigator Help page for more.
Embeddable Map Widget for your web page
The widget is designed to be added into web pages such as Office of Technology Licensing (OTL) technology disclosure pages or academic lap project pages or even your investigator profiles by inserting a line of code. The code inserts an iFrame element into your web page which shows your user the interactive widget. The topic of the widget is set by the topic ID. In this case, the topic ID is FMI:4488. You can find the topic ID in the URL of the page as shown in Navigator. For single Topics you can use this "hard-coded" example:
Embed Script with hard-coded ID
<html>
    <body>
      <script id='visleg-widget-script'
           src="https://api.visiblelegacy.com/widget_script.php?height=400&width=600&id=FMI:4488">
      </script>
    </body>
</html>
As of 2021 we are introducing a version of this widget script which detects the ID from the web page itself. This is useful for Technology Licensing Offices that are using an Innovation Management system such as Inteum Minuet. Visible Legacy collects a cross-walk of IDs from Inteum users so we will have the data for the widget.
Embed Script detect page ID
<html>
    <body>
      <script id='visleg-widget-script'
           src="https://api.visiblelegacy.com/widget_script.php?height=400&width=600">
      </script>
    </body>
</html>
The script may be styled like the hard-coded example using height and width parameters. The height and width are new parameters in the src= url, you can specify a number like 400 and that is interpreted in px, or you can specify a percent like 100% or 50%, and that is a fraction of whatever div is sized in the existing page for the block. You do not need to wrap it in a div. If a topic does not exist in the Visible Legacy knowledge base no code will be inserted and the page will not be modified.
Our legacy widget embed code (below) which we have offered since 2012 is a hard-coded version currently used in lab pages and investigator profiles. It is still supported but please note that it uses an http address (not https) and is not recommended for future use.
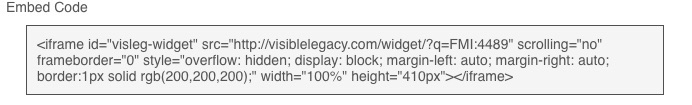
Legacy iFrame Embed Code with hard-coded ID
<html>
    <body>
      <iframe id='visleg-widget'
           src="http://visiblelegacy.com/widget/?q=FMI:4489" scrolling="no" frameborder="0" style="overflow: hidden; display: block; margin-left: auto; margin-right: auto; border:1px solid rgb(200,200,200);" width="100%" height="410px">
      </iframe>
    </body>
</html>
Use of embedded widgets is governed by these Terms. If you are interested in broad integration of widgets into your website, please contact us.
This video example from our Blog shows you an overview of the Visible Legacy Widget in use.