Show the impact of your grants
|
The Visible Legacy Navigator presents the timeline of innovation through the collaboration of organizations of people working on projects. Use Navigator maps and profiles to show the impact of your grant-funded projects to your stakeholders. You can link to your map or detail pages by URL, or you can embed the map right in your page. Automatically collected and organized The information shown in the maps and lists is curated automatically from public online sources. You don't need to enter or maintain in Visible Legacy. Data for your grant organization is shown in map form as in Figure 1. Visible Legacy collects grant data from NIH REPORTER, NSF, public foundation sites, etc. Metrics are summarized by investigator and displayed on their Detail page as shown in Figure 2. Show your grants in time and by grantee The resulting investigator maps may then be used by stakeholders to trace the follow-on funding, projects, papers, patents, licensing and companies founded arising from the collaborations over time. See Figure 3. Please see this Blog post for the background on this image. We'll expedite including your sources If your grant data are not already in our knowledge map, please feel free to contact us to expedite adding your sources to our collection engine. For a limited time we're expediting grant databases of funding in the academic research community. If you have a public-facing web page or feed please use the Contact Us form with "grant data expedite" in the subject.
|
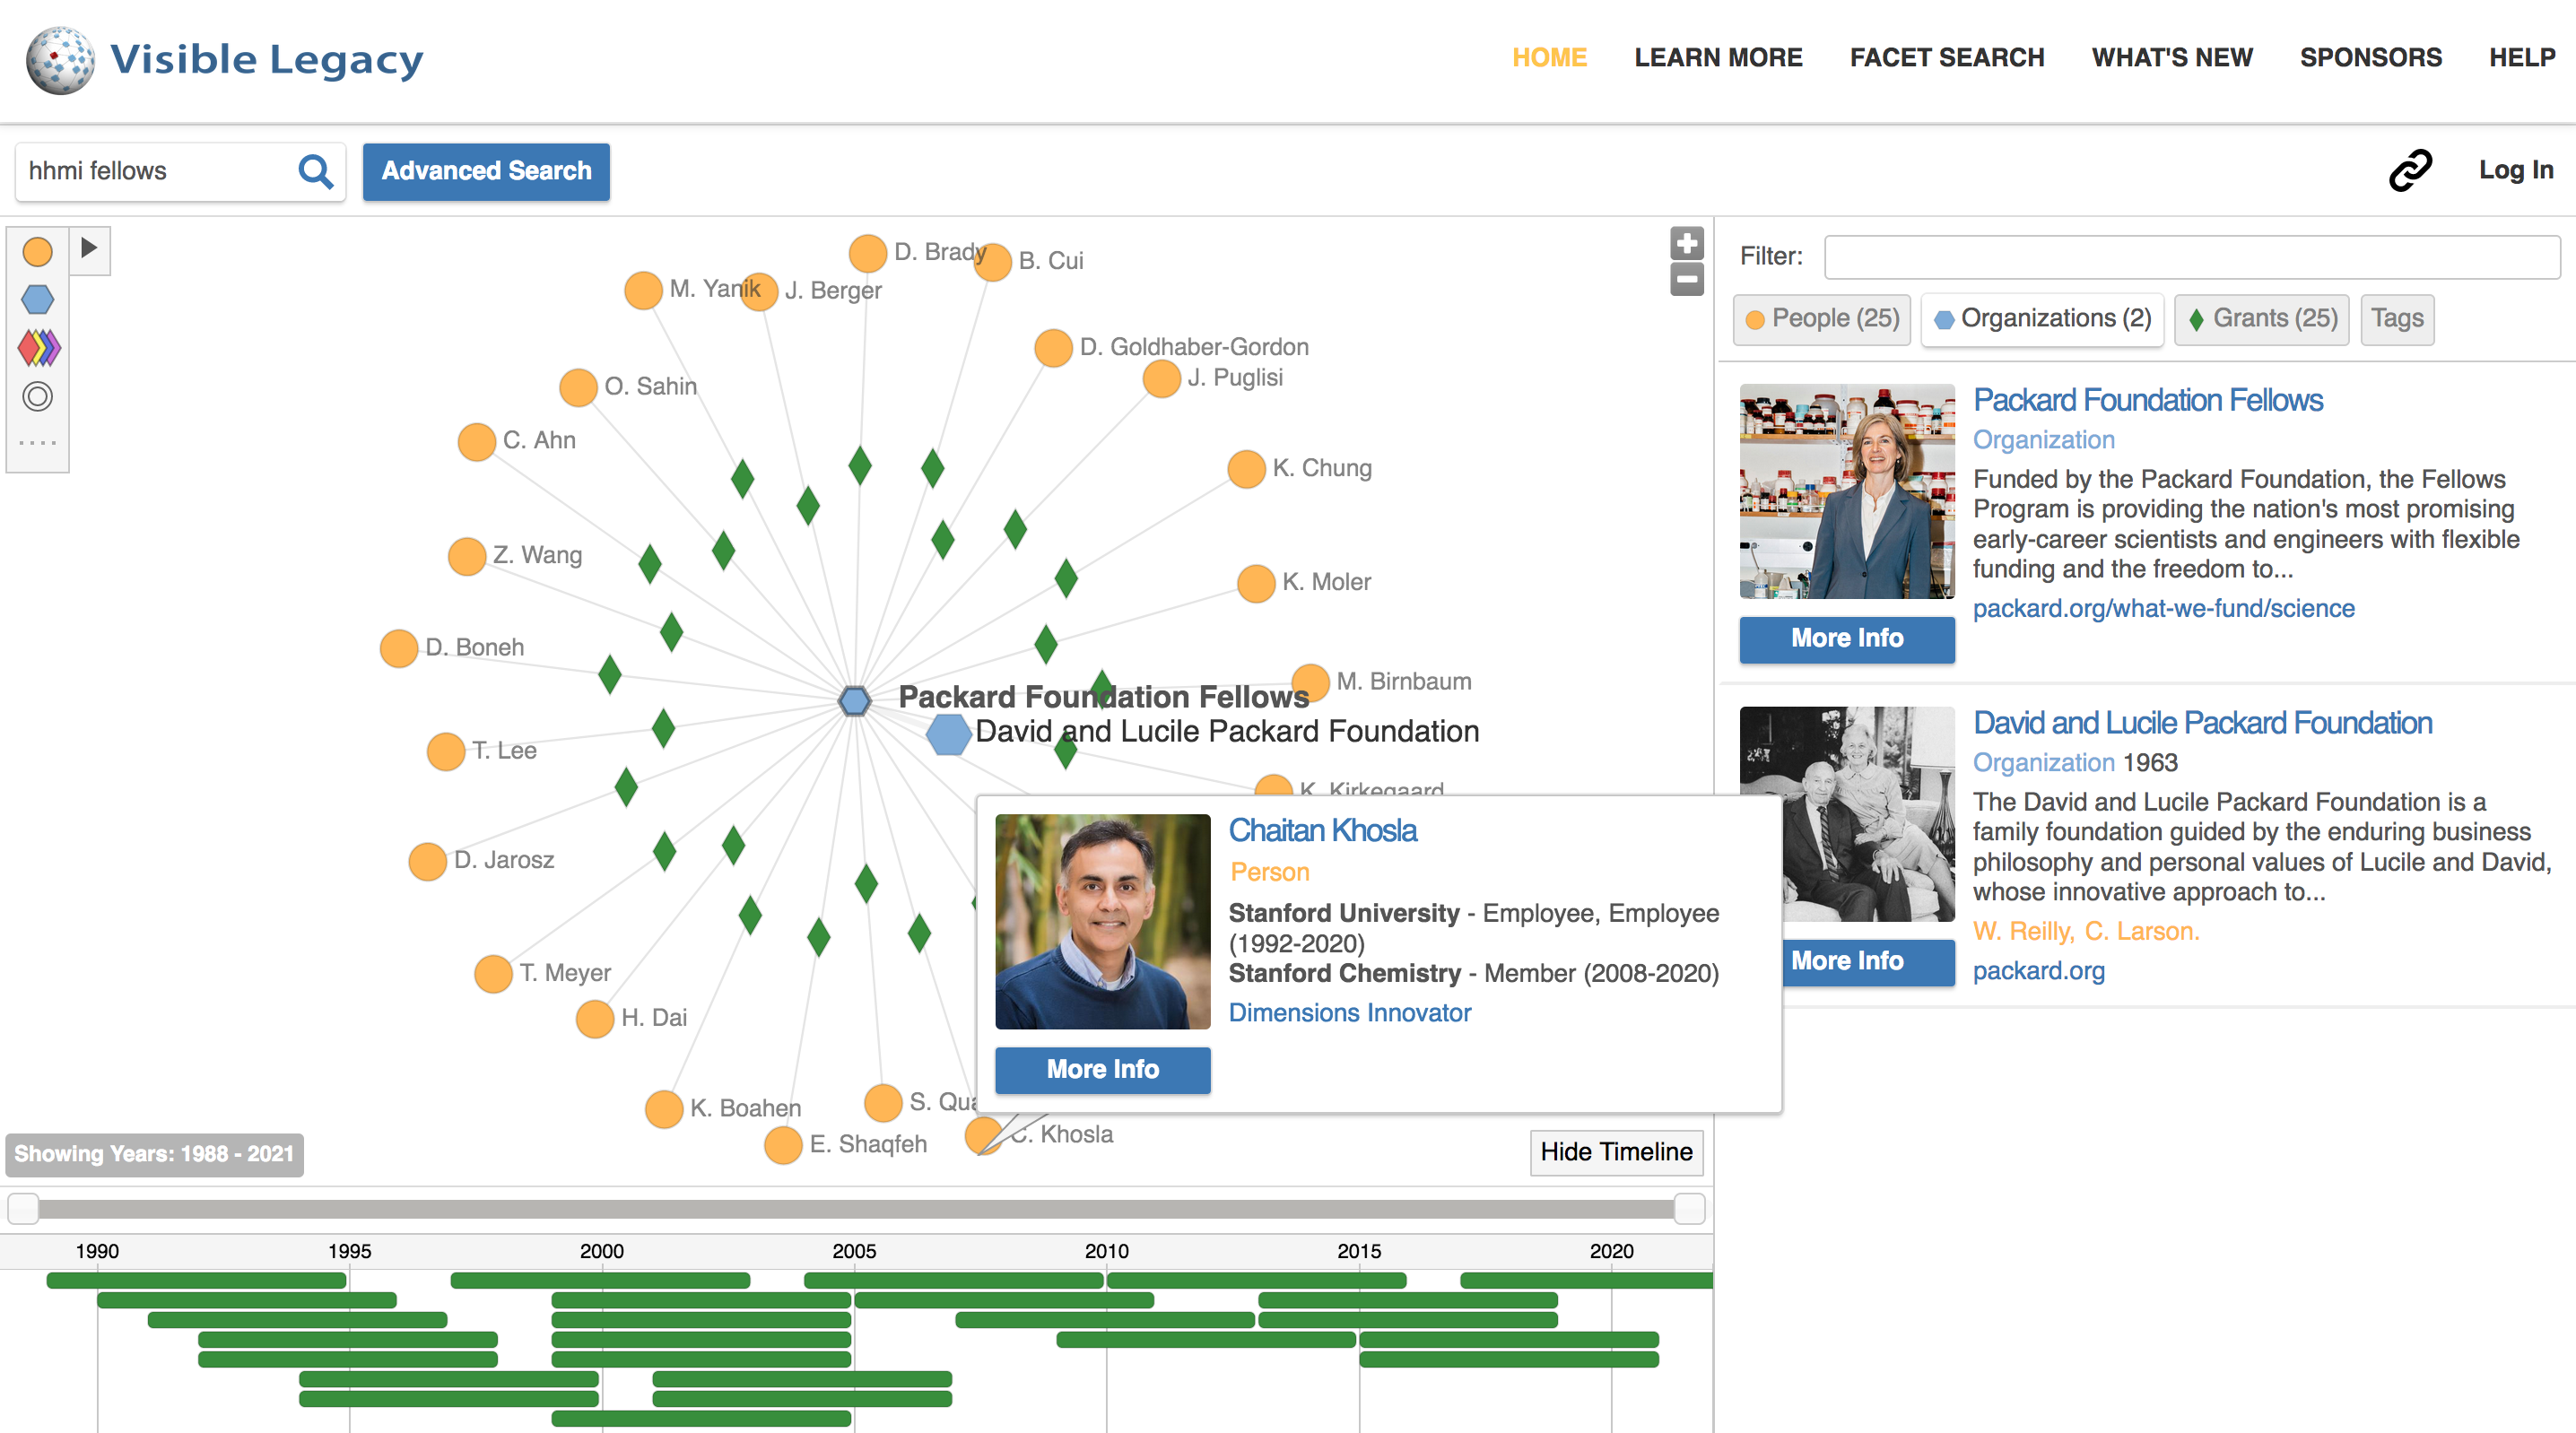 Figure 1 (above). The Visible Legacy Navigator page shows the context of people, projects and featured works to visualize collaborations over time. The image above is the "map" page found by clicking the View Map button. This example is centered around the granting organization showing sponsored investigators. Figure 2 (below). The image below is the "detail" page found by clicking the More Info button. The grant metrics and outputs are shown under the investigator photo in the left column. 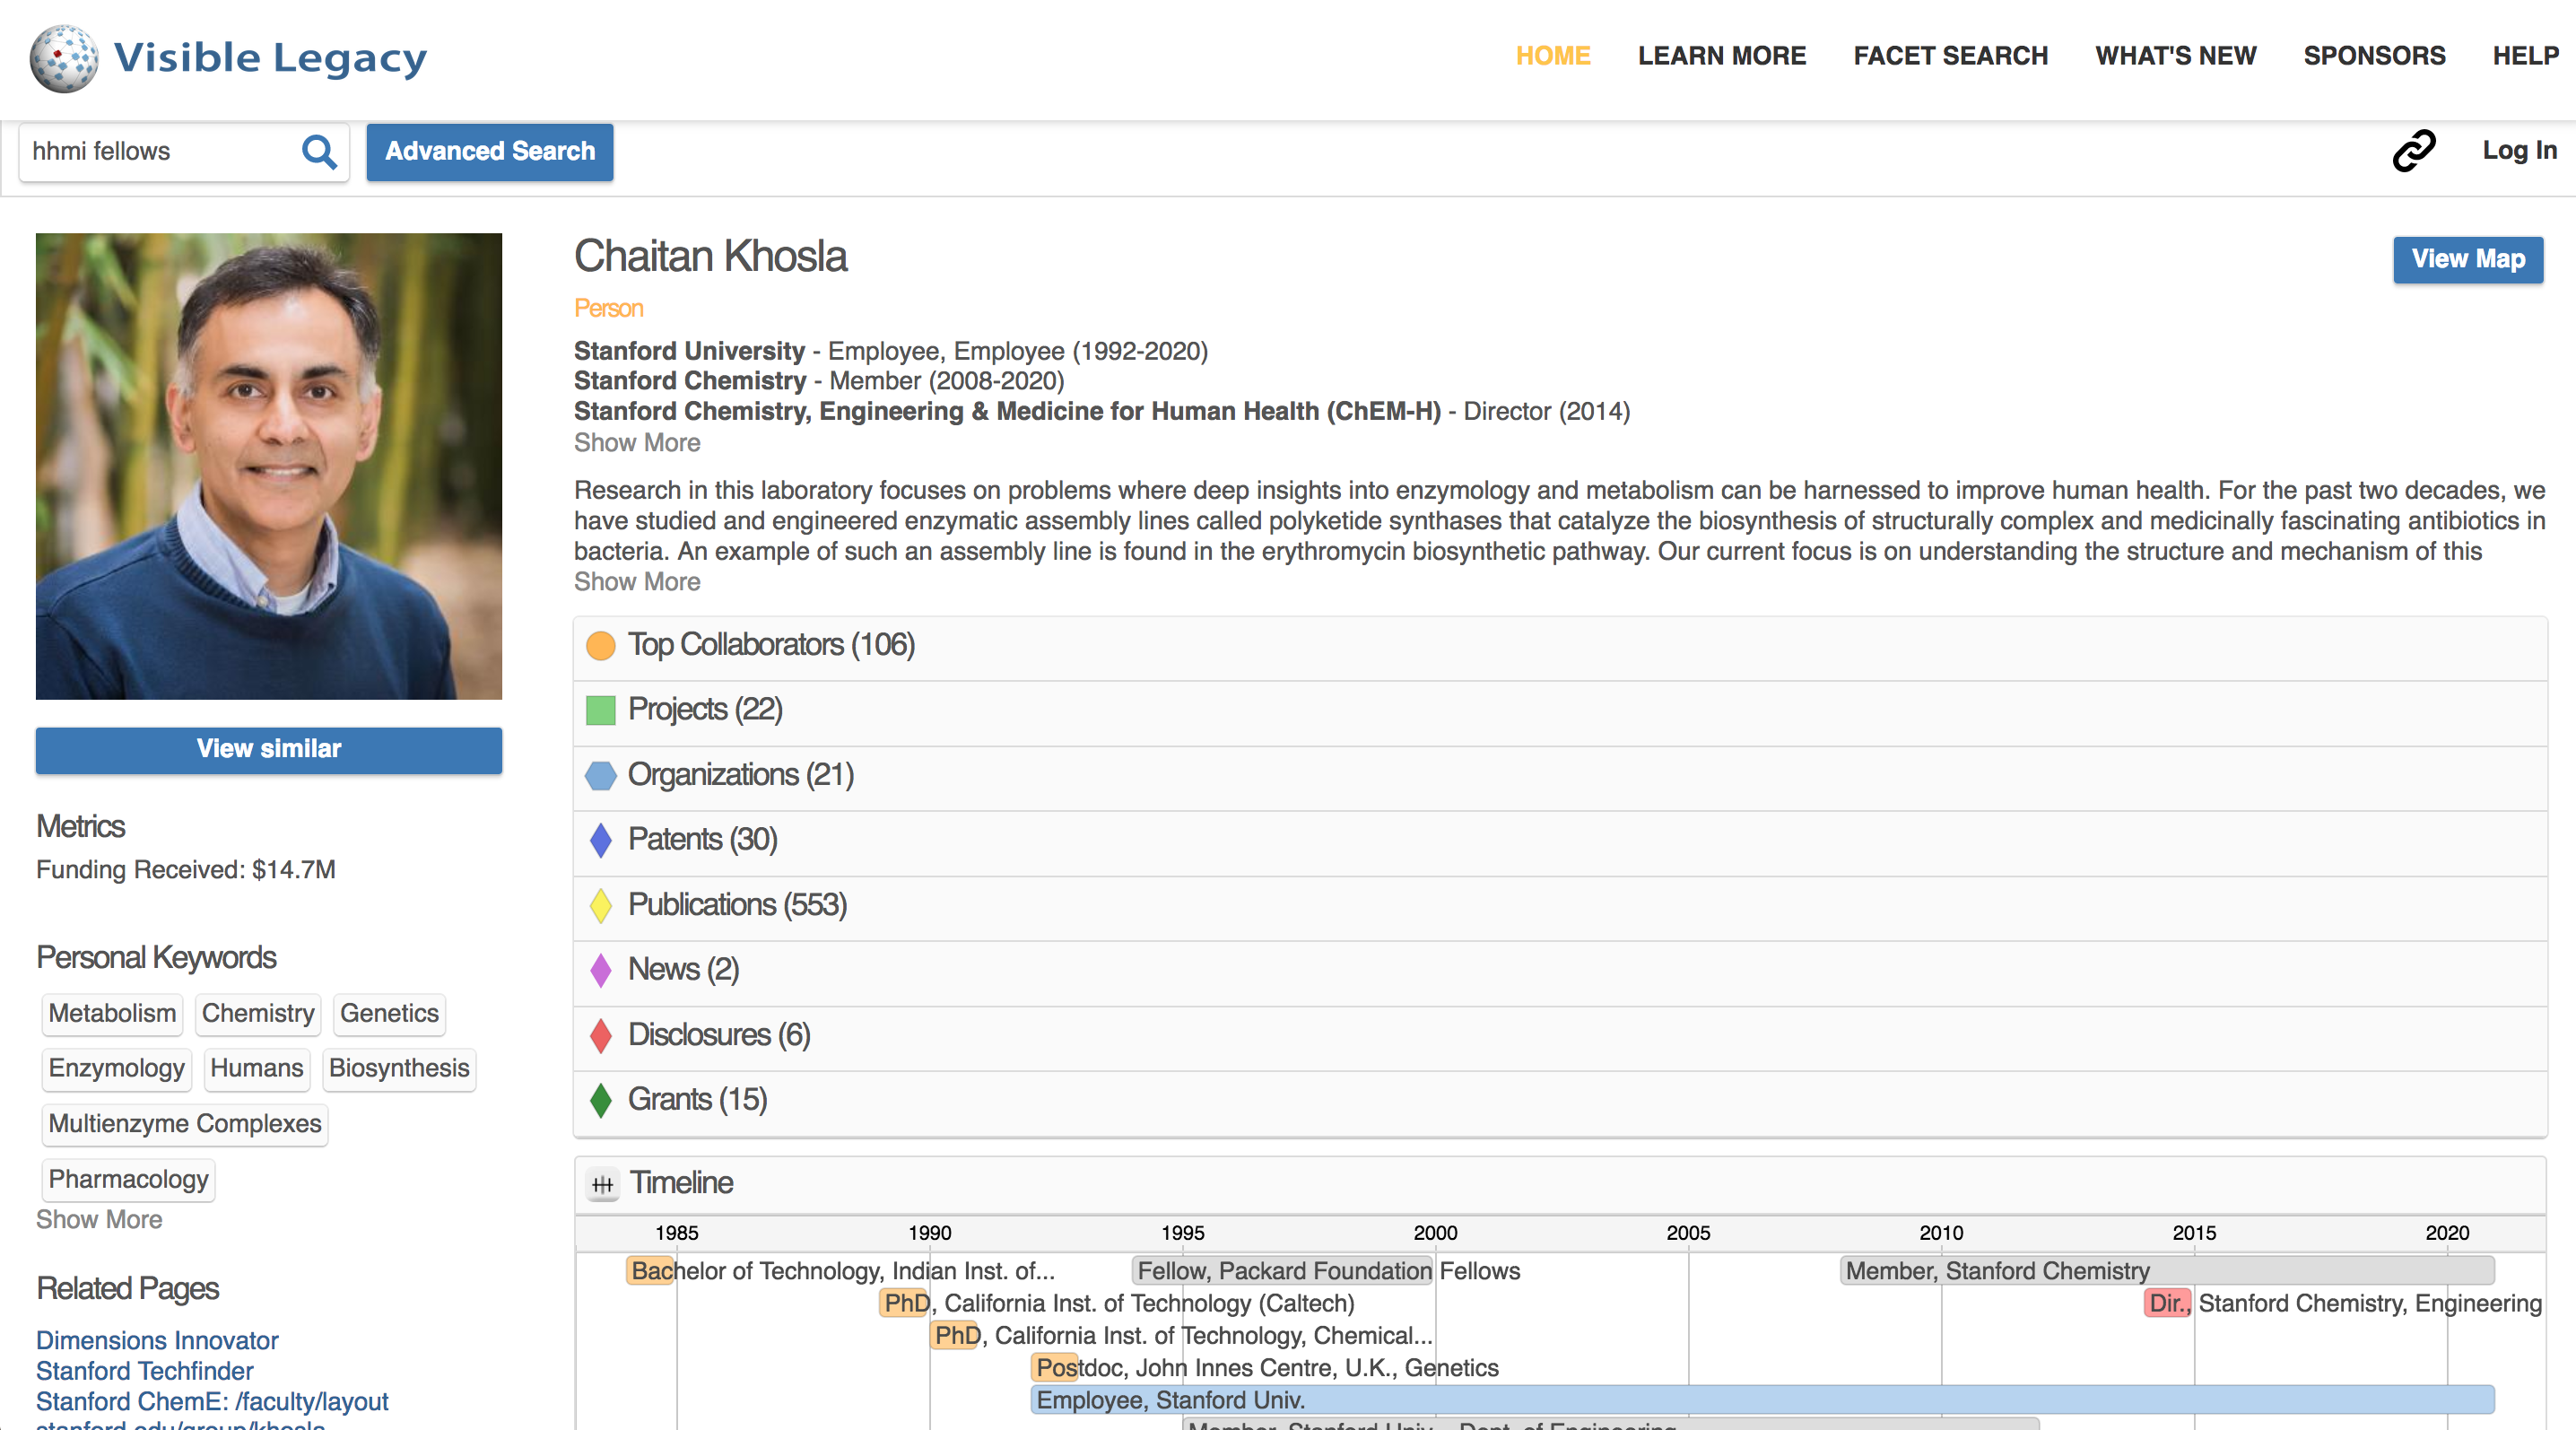
Figure 3 (below). The resulting investigator maps may then be used by stakeholders to trace the follow-on funding, projects, papers, patents, licensing and companies founded arising from the collaborations over time. 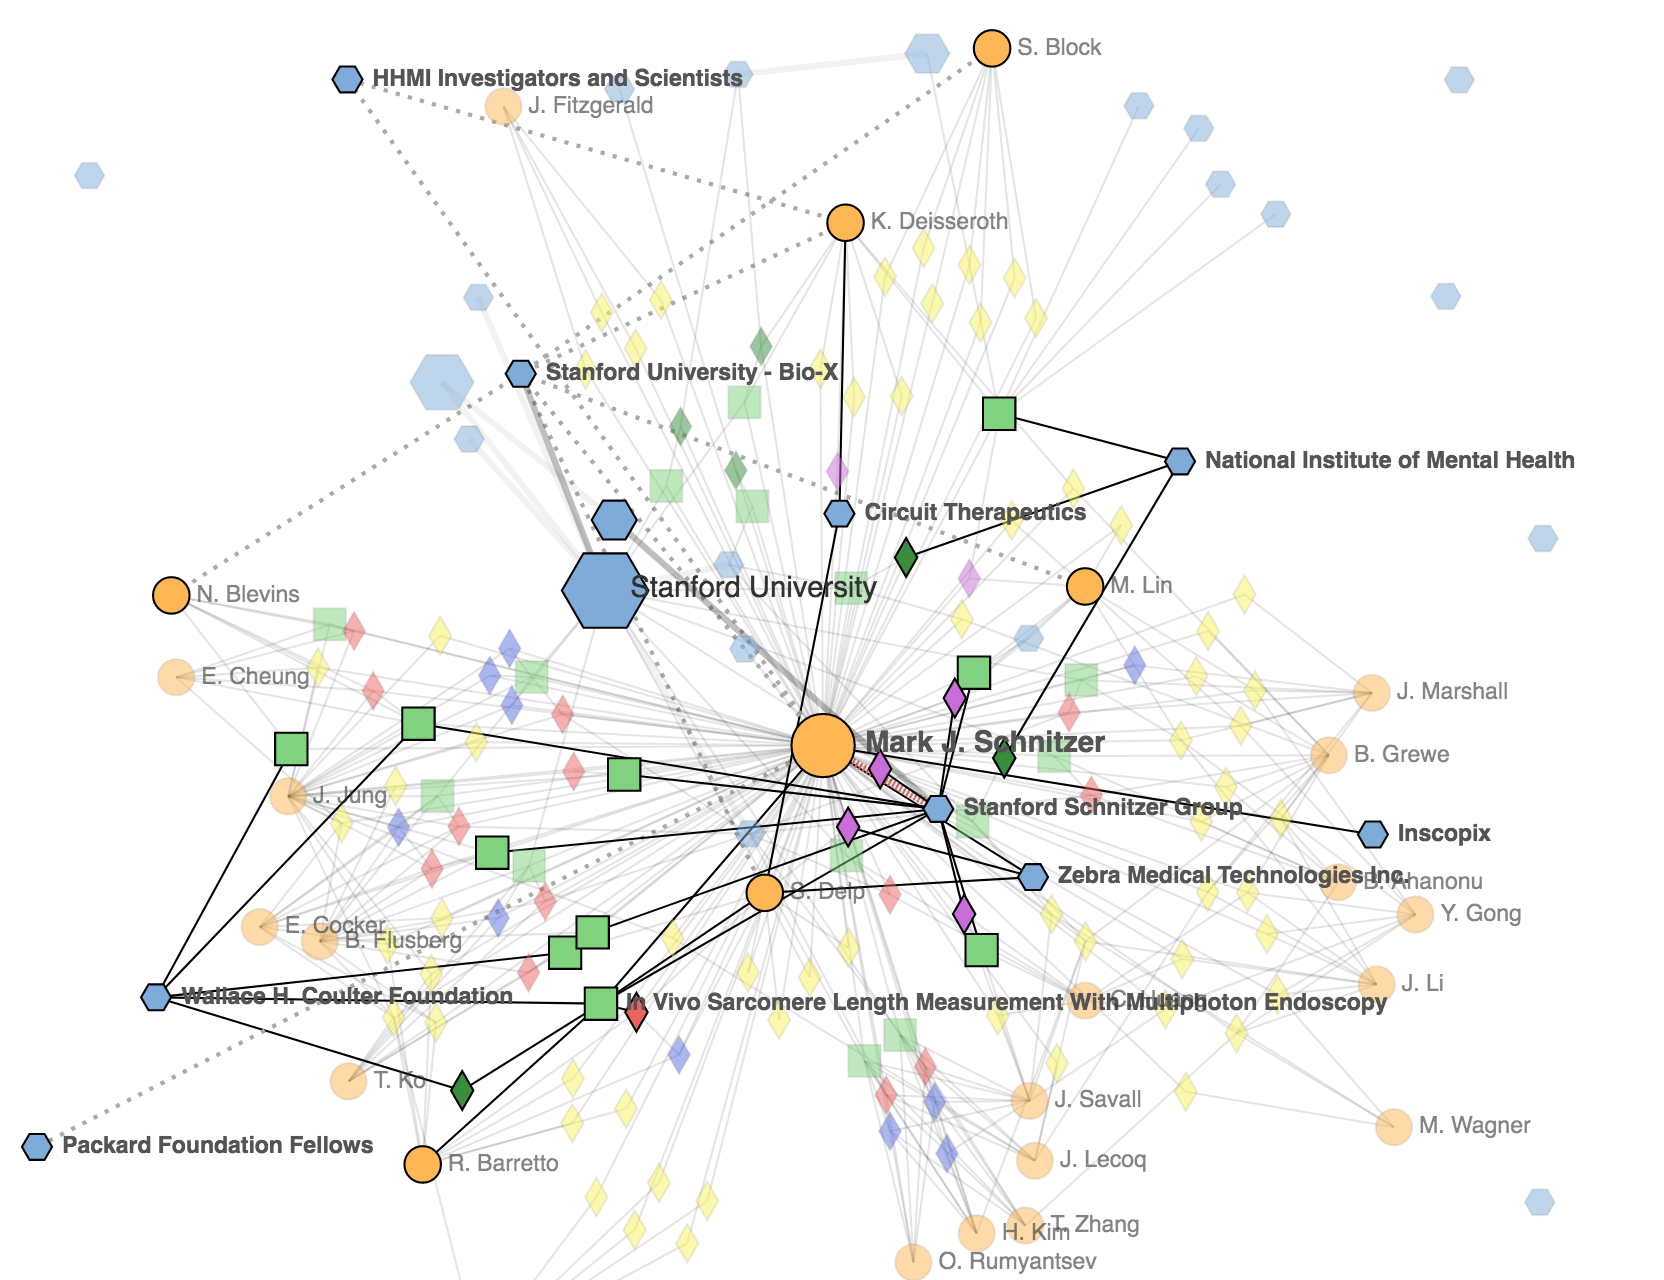 |